
Why Market Cap Data Matters More Than Price Tags
Crypto market cap is the total value of all coins in circulation, calculated by multiplying the current price by the circulating supply. Here’s what you need to know:
Quick Market Cap Facts:
– Total crypto market cap: $3.62 trillion (as of latest data)
– Bitcoin dominance: 56.1% of total market
– Ethereum dominance: 10.4% of total market
– Calculation: Circulating Supply × Current Price = Market Cap
Market Cap Categories:
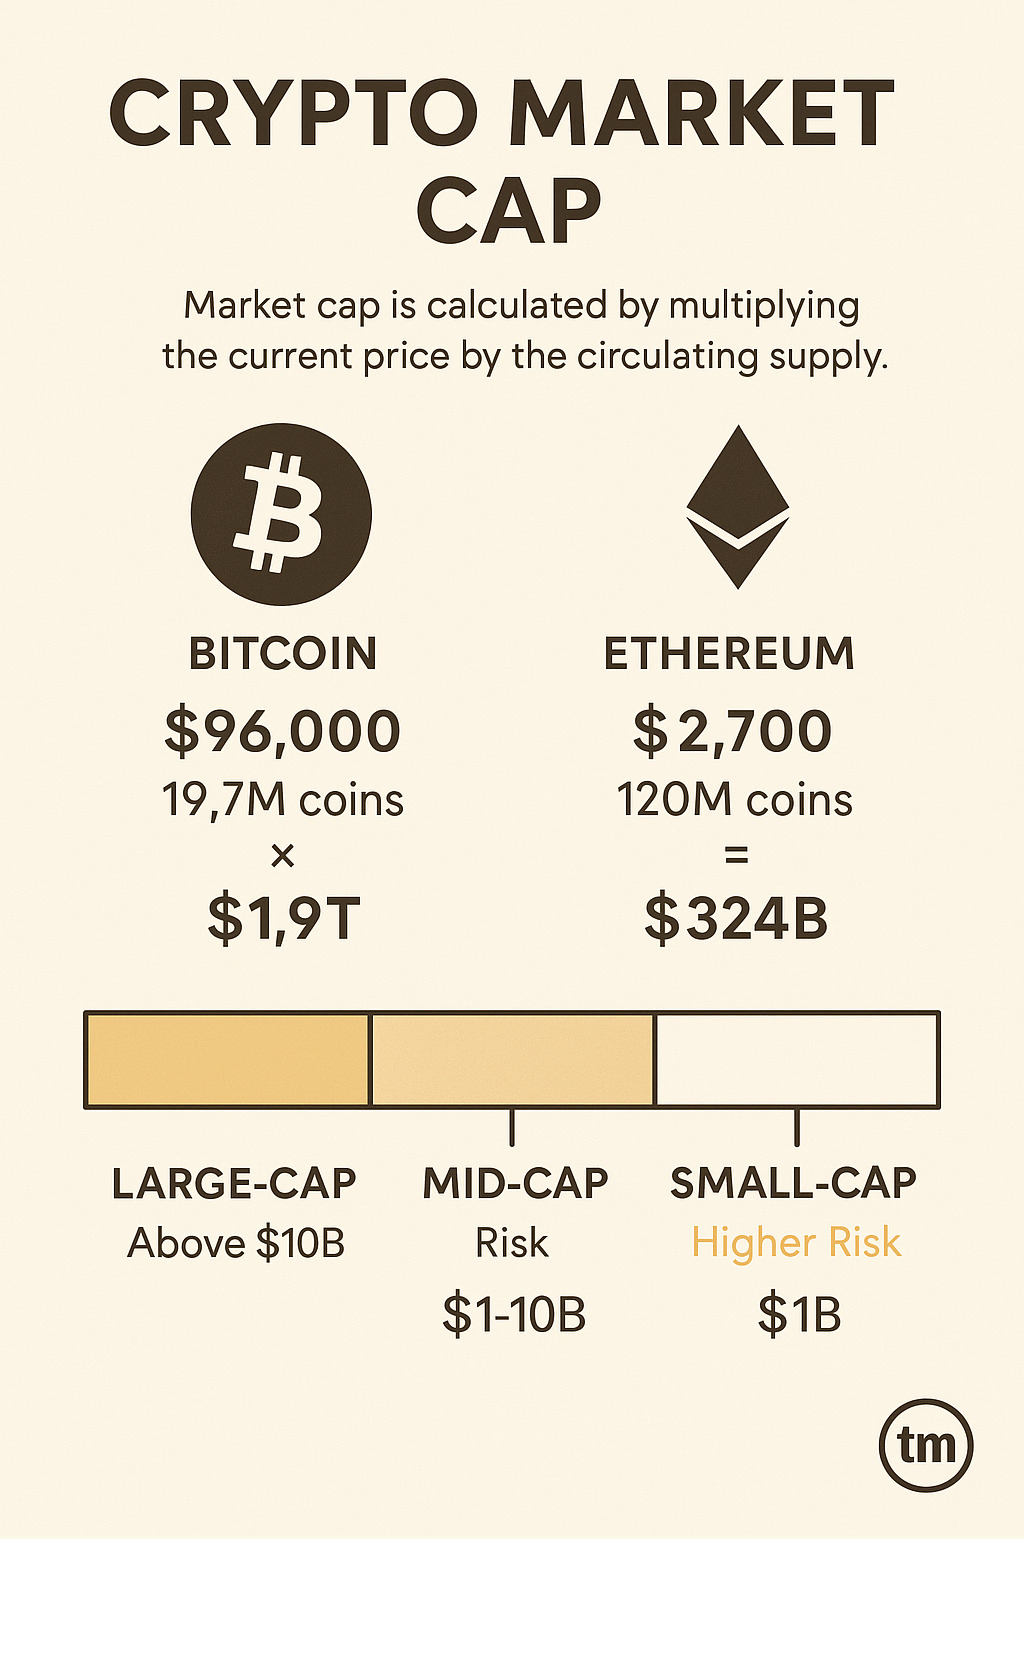
– Large-cap: Above $10 billion (Bitcoin, Ethereum)
– Mid-cap: $1-10 billion (higher growth potential, more risk)
– Small-cap: Under $1 billion (highest risk and volatility)
Looking at a $50 crypto coin might seem expensive compared to a $5 one. But that’s like judging a company by its stock price alone.
The $5 coin could have 10 billion tokens in circulation (market cap: $50 billion). The $50 coin might only have 1 million tokens (market cap: $50 million). Suddenly, the “expensive” coin looks tiny.
Market cap tells you the real size of a cryptocurrency. It’s your best tool for comparing different coins and understanding what you’re actually buying into.
For young professionals building wealth, understanding market cap helps you spot the difference between established players and risky bets. It’s the foundation for making smart allocation decisions in your crypto portfolio.
Why Charts Matter
Charts transform overwhelming numbers into actionable insights. When you’re tracking crypto market cap across thousands of coins, visual data becomes your best friend. We’ve all been there – staring at endless rows of numbers, trying to make sense of which cryptocurrencies are actually worth our attention.
Good charts help you spot trends at a glance. Is the total market growing or shrinking? Are investors rotating from Bitcoin into altcoins? Is DeFi gaining ground? These patterns emerge clearly when data is visualized properly.
Charts also save time. Instead of calculating market cap changes manually, you can see momentum shifts instantly. For busy professionals managing their wealth alongside demanding careers, this clarity is invaluable for making quick, informed decisions.
What Is Crypto Market Cap & Why It Matters
Picture crypto market cap as the total dollar value of all coins floating around in the market. It’s surprisingly simple to calculate – just multiply how many coins are currently available (circulating supply) by the current price of each coin. This gives you the complete picture of what the entire cryptocurrency is worth.
Think of it like this: if every single coin of a cryptocurrency was sold today, the market cap tells you roughly how much money would change hands. It’s your best tool for understanding the true size and importance of any crypto project.
Market cap becomes your valuation yardstick when comparing different cryptocurrencies. You wouldn’t judge the size of a business by looking at individual product prices, right? A luxury car dealership might have higher-priced items than a grocery store, but the grocery chain could still be worth billions more. The same logic applies to crypto.
Large-cap cryptocurrencies above $10 billion are like the established giants of the crypto world. Bitcoin and Ethereum sit comfortably in this category. They’re more stable, have better trading volume, and won’t vanish overnight. If you’re just starting your crypto journey, these are your safer bets.
Mid-cap cryptocurrencies between $1-10 billion offer an interesting middle ground. They’ve proven they can survive market downturns and have real user adoption, but still have room to grow significantly. These projects often represent cutting-edge innovation that hasn’t reached mainstream adoption yet.
Small-cap cryptocurrencies under $1 billion are where things get exciting – and risky. These can multiply your investment by 10x or more, but they can also disappear completely. Only put money here that you’re completely comfortable losing.
Here’s something important many people miss: there’s a difference between circulating market cap and fully diluted market cap. Circulating market cap only counts coins available right now. Fully diluted assumes all possible coins have been released into the market.
Why does this matter? Many crypto projects have millions of tokens locked away, scheduled to be released over months or years. When those tokens hit the market, they could dilute the value of your investment. Always check both numbers before investing.
Crypto Market Cap vs Coin Price
This is where crypto market cap becomes your secret weapon against one of the most common investing mistakes. The price per coin tells you almost nothing about whether a cryptocurrency is expensive or cheap.
Here’s a real example that might surprise you. Let’s say Coin A costs $0.50 and has 2 billion coins in circulation. Its market cap is $1 billion. Coin B costs $100 and has 5 million coins in circulation. Its market cap is $500 million. Even though Coin B costs 200 times more per coin, Coin A is actually the bigger, more valuable project.
Supply dynamics create these seemingly backward situations. Some cryptocurrencies deliberately create billions or even trillions of tokens. Others, like Bitcoin, cap their supply at 21 million coins. The total supply dramatically affects the price per coin, but market cap reveals the real story.
We’ve seen smart people avoid Bitcoin because they thought $50,000 per coin was “too expensive” while buying coins that cost pennies but had massive market caps. Don’t let this perception trap fool you. A $0.01 coin with 100 billion tokens in circulation has the same market cap as a $1,000 coin with 100 million tokens.
Crypto Market Cap vs Traditional Market Cap
Crypto market cap works on the same basic principle as stock market cap – total shares times price per share. But the crypto world has some unique quirks that make things more interesting.
Traditional companies have fairly straightforward share structures. There might be some restricted stock or employee options, but the basics are well-established. Crypto projects, on the other hand, often have complex token distribution schemes with coins locked in smart contracts, held by founders, or reserved for future ecosystem rewards.
This creates free-float issues that don’t exist in traditional markets. When you see a crypto’s market cap, some of those tokens might not actually be available for trading. It’s like counting restricted company shares as if they were freely tradable – the numbers can be misleading.
For your diversification strategy, understanding market cap becomes crucial. You want to know if you’re putting 50% of your crypto allocation into one massive project or spreading it across different size categories. Market cap helps you balance your risk across the established giants, promising mid-caps, and speculative small-caps.
The good news? Once you understand these differences, crypto market cap becomes just as useful as traditional market cap for making smart investment decisions.
The Best Crypto Market Cap Chart Platforms (Roundup)
Finding the right platform to track crypto market cap can feel overwhelming with so many options out there. We’ve spent countless hours testing different platforms to find the ones that actually make sense for real people building wealth. Here are the tools that rise above the noise and deliver clear, actionable insights.
The best platforms share a few key features: real-time dashboards that don’t lag behind market movements, altcoin filters that help you cut through the noise of thousands of projects, and mobile apps that let you check your research on the go. Some also offer TVL overlays that show you how much money is actually being used in DeFi protocols, not just speculated on.
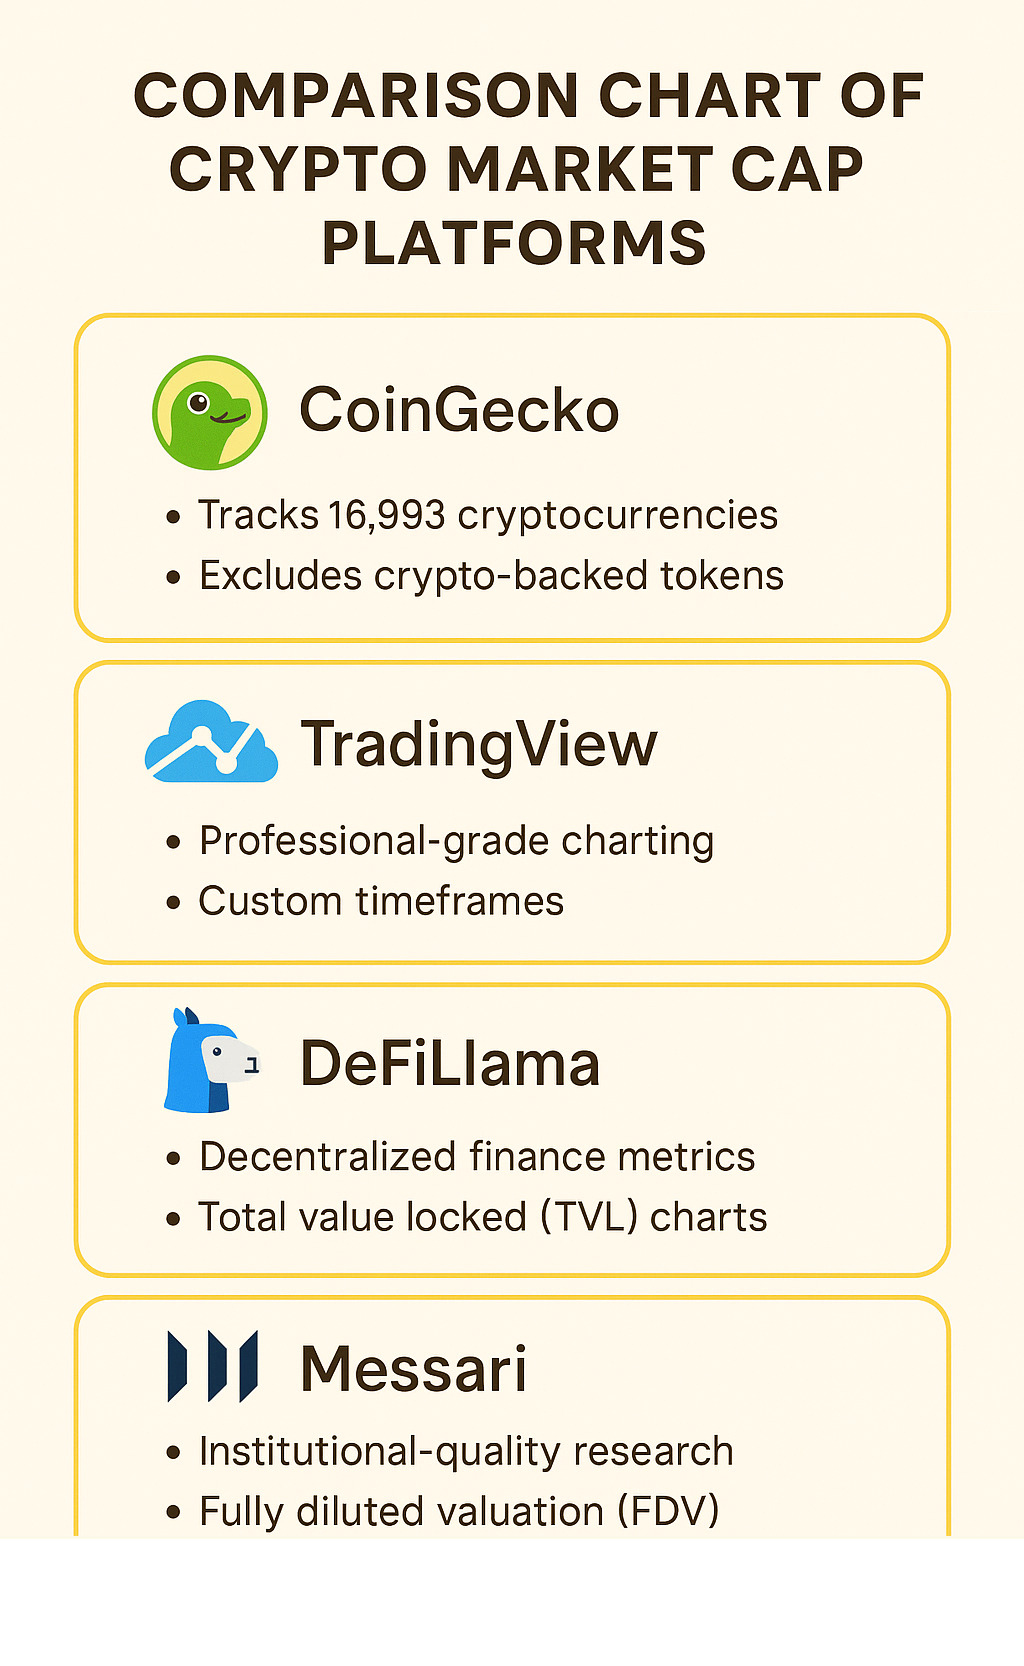
CoinGecko Global Charts
CoinGecko has become our go-to for clean, reliable crypto market cap visualization. When you land on their global charts, you immediately see the total market sitting at $3.62 trillion with clear 24-hour change indicators. No hunting around for basic information.
What really sets CoinGecko apart is their dominance heatmap. You can instantly see Bitcoin’s 56.1% dominance and Ethereum’s 10.4% share. This matters more than you might think. When Bitcoin dominance rises, it usually means investors are getting nervous and moving to safer crypto assets. When it falls, people are feeling adventurous and buying riskier altcoins.
The platform tracks an impressive 16,993 cryptocurrencies across 1,290 exchanges, giving you comprehensive coverage without the overwhelm. They’re smart about excluding crypto-backed tokens to avoid double-counting, which keeps their market cap figures honest.
For those who like to dig deeper, their API access is solid and reliable. Latest research on market data accuracy consistently ranks CoinGecko among the most trustworthy sources, which matters when you’re making real money decisions.
TradingView Total Cap Series
TradingView brings professional-grade charting tools to crypto market cap analysis without making you feel like you need a finance degree. Their custom timeframes let you zoom from minute-by-minute volatility all the way out to multi-year trends, depending on what you’re trying to understand.
The real magic happens with their technical overlays. You can apply moving averages, support and resistance lines, and other indicators directly to market cap charts. This helps you spot when the overall crypto market might be due for a bounce or a correction.
Their sharing tools make collaboration simple. Save your chart setups and share them with your financial advisor or investment group. If you’re managing money with a partner or getting advice from professionals, this collaborative approach saves everyone time.
DeFiLlama TVL & Cap Combo
DeFiLlama specializes in decentralized finance metrics, offering insights you won’t find on traditional platforms. Their protocol metrics show not just market cap, but how much capital is actually locked up and being used in DeFi protocols.
Currently, DeFi represents $9.84 billion in volume, about 8.50% of total crypto market activity. This stablecoin share analysis helps you understand whether we’re seeing real economic activity or just speculation. With stablecoins representing 89.57% of trading volume ($103.59 billion), you get a clearer picture of market liquidity.
The on-chain transparency that DeFiLlama provides acts like a reality check. Market cap numbers can be manipulated through various tricks, but TVL requires real assets locked in smart contracts. It’s harder to fake actual usage.
Messari Screener
Messari brings institutional-quality research tools to regular investors without the institutional price tag. Their sector tags help you understand what each project actually does beyond just looking at market cap numbers.
The FDV column (fully diluted valuation) is crucial for avoiding nasty surprises. A project might have an attractive circulating market cap, but if they have millions of locked tokens waiting to be released, your investment could get diluted significantly.
Their enterprise filters let you screen by specific criteria like market cap ranges, sector focus, and geographic regions. This saves hours of manual research when you’re trying to build a balanced portfolio across different crypto categories.
How to Use Market Cap in Your Investment Research
When you’re building wealth through crypto investments, crypto market cap becomes your strategic compass. Instead of chasing the latest trending coin, smart investors think in terms of risk buckets that align with their financial goals.
Portfolio sizing should reflect your risk tolerance and life stage. If you’re in your twenties with decades to recover from setbacks, you might allocate 50% to large-cap cryptos, 35% to mid-cap projects, and 15% to small-cap opportunities. But if you’re closer to retirement or have major financial commitments, a more conservative 80/15/5 split makes sense.
Growth potential inversely correlates with market cap size. A cryptocurrency with a $1 billion market cap doubling to $2 billion requires significantly less capital inflow than pushing Bitcoin from $1.9 trillion to $3.8 trillion. This mathematical reality shapes realistic return expectations.
Pay attention to on-chain supply dynamics that traditional market cap calculations might miss. Many projects have tokens locked in smart contracts, vesting schedules, or governance mechanisms. These locked tokens inflate market cap figures but create future selling pressure when they open up.
Market sentiment indicators like the Fear & Greed Index help time your market cap-based decisions. When the index shows extreme fear, even quality large-cap projects get oversold. During extreme greed periods, questionable small-cap projects reach absurd valuations.
Understanding these dynamics helps you buy quality assets when they’re undervalued and avoid overpaying during market euphoria. Your investment research becomes more systematic and less emotional.
More info about Crypto Investing 101
Reading Large-Cap Stability Signals
Bitcoin dominance acts like crypto’s version of the VIX – it reveals market stress levels instantly. When Bitcoin’s share of total crypto market cap climbs above 60%, investors are seeking relative safety within the crypto ecosystem.
At the current 56.1% dominance level, we’re seeing moderate risk appetite. People aren’t panicking into Bitcoin, but they’re not completely abandoning it for speculative altcoins either. This suggests a balanced market where both established and emerging projects can thrive.
Large-cap cryptocurrencies increasingly mirror traditional markets during crisis periods. The 2022 bear market showed us that when stocks crash, crypto follows – even supposedly “uncorrelated” Bitcoin and Ethereum. This correlation reduces crypto’s portfolio diversification benefits but makes price movements more predictable.
Watch for safe-haven rotation patterns during volatile periods. If total crypto market cap is declining but Bitcoin dominance is rising, money is flowing from risky altcoins toward “safer” Bitcoin. These rotation periods often mark market bottoms and present buying opportunities for patient investors.
Spotting Mid-Cap Sweet Spots
Mid-cap cryptocurrencies occupy the goldilocks zone for most investors – not too risky, not too stable, but just right for meaningful growth. These projects typically have proven themselves beyond the idea stage while maintaining enough upside potential to justify the additional risk.
Innovation serves as the primary catalyst for mid-cap success. Look for projects solving real-world problems with measurable adoption metrics. A crypto market cap of $5 billion backed by growing user bases and increasing transaction volumes is more compelling than a $3 billion project with stagnant fundamentals.
Adoption curves matter more than absolute market cap numbers in this category. Early-stage network effects can drive exponential growth as projects reach critical mass. Think of how Ethereum’s DeFi ecosystem exploded once it reached sufficient liquidity and developer activity.
Major roadmap milestones provide timing opportunities for mid-cap investments. Unlike large-cap projects where news gets quickly absorbed, mid-cap cryptocurrencies can experience sustained momentum from partnership announcements, technical upgrades, or regulatory approvals. These catalysts often create windows for strategic entry points.
Navigating Small-Cap Volatility
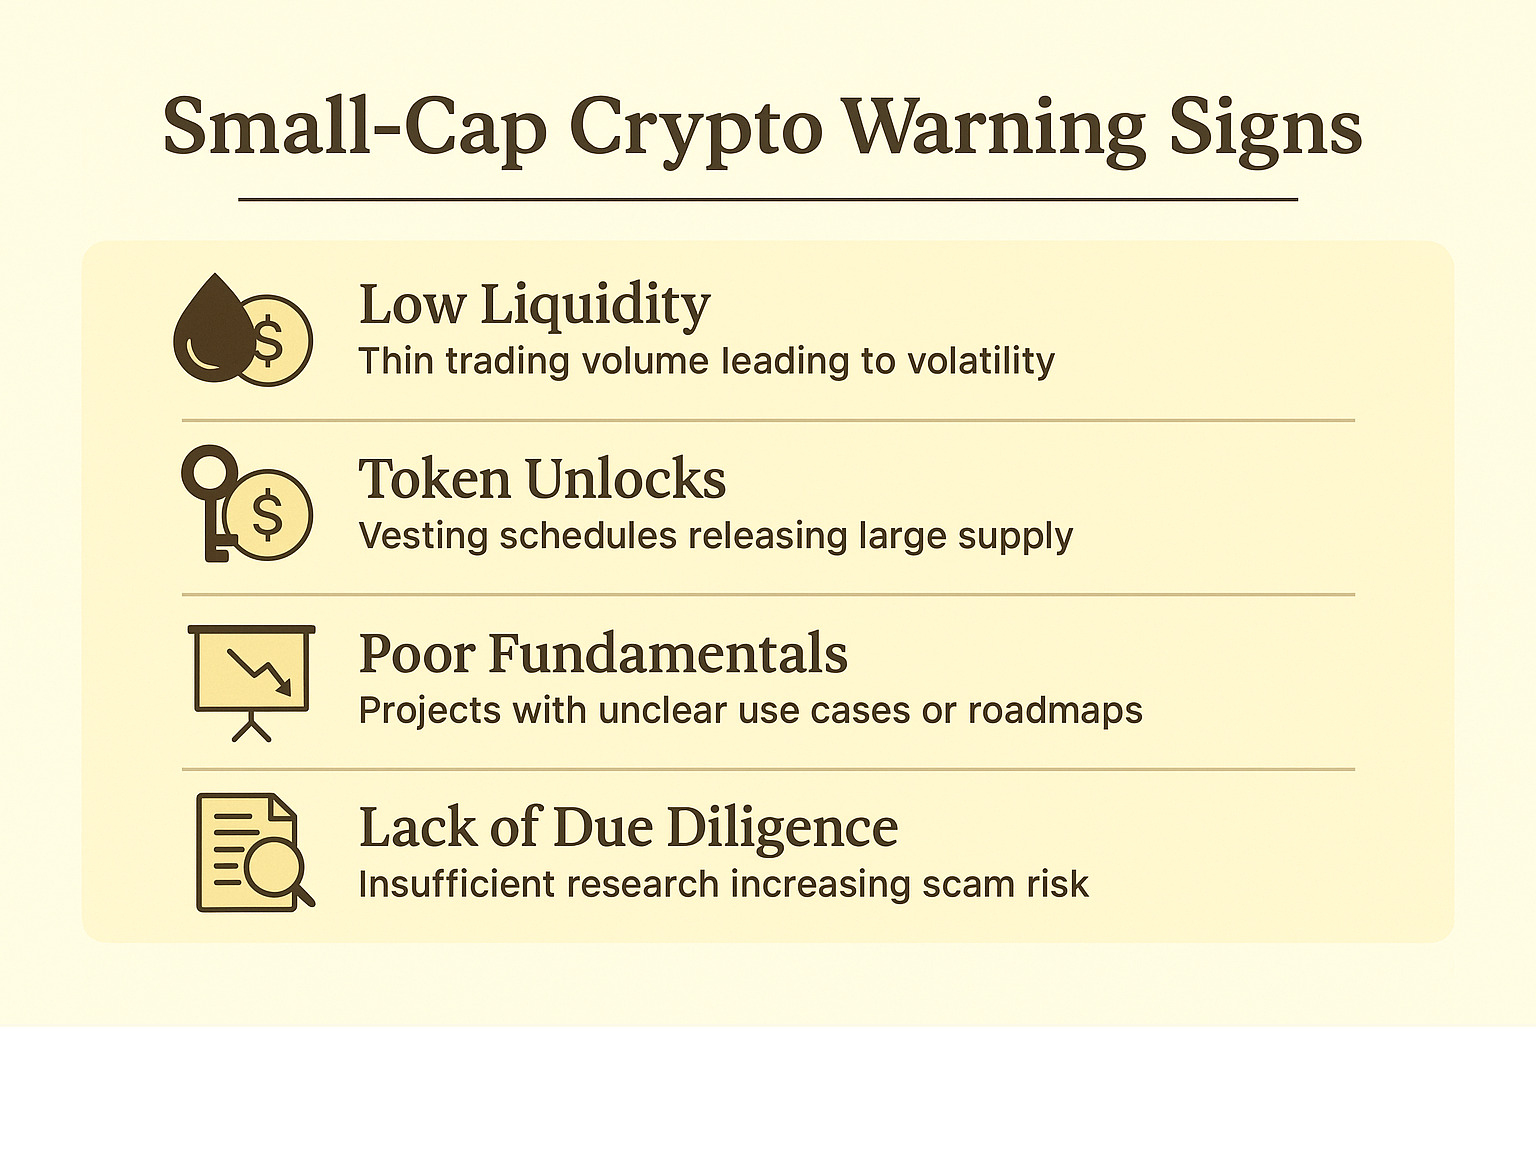
Small-cap cryptocurrencies demand extreme caution and represent the wild west of crypto investing. Their low market caps make them vulnerable to manipulation, and thin trading volumes can create dramatic price swings on relatively small trades.
Liquidity traps pose the biggest risk in small-cap investing. A project might boast a $100 million market cap, but if only $5,000 worth trades daily, you might not be able to exit your position without crashing the price. Always compare 24-hour trading volume to market cap before investing.
Token open up schedules can devastate small-cap prices regardless of project fundamentals. Many projects have founder allocations, team tokens, or investor shares that release over time. When these locked tokens hit the market, they can flood supply and crush prices even for legitimate projects.
Due diligence becomes your lifeline at small market caps. With less coverage from major analysts and media outlets, scams and failed projects flourish in this space. Verify team credentials through LinkedIn, audit smart contract code, and thoroughly understand tokenomics before committing capital you can’t afford to lose completely.
Limitations & Common Misconceptions
Crypto market cap looks clean and scientific on paper, but the reality is messier than most investors realize. Think of it like judging a restaurant by how many customers it seats rather than how many actually show up for dinner.
Market manipulation runs rampant in crypto, especially compared to traditional markets. With lighter regulation and smaller overall market sizes, it’s surprisingly easy for wealthy players to move prices. A few coordinated trades can artificially inflate a project’s market cap, making it appear more valuable than it really is.
Wash trading creates some of the biggest distortions you’ll encounter. This happens when exchanges or projects essentially trade with themselves to fake activity. Imagine a store owner buying their own products repeatedly to make the business look busy. The crypto market cap might show impressive numbers, but the underlying demand is hollow.
Thin liquidity turns market cap into a bit of a mirage. You might see a cryptocurrency with a $1 billion market cap and think it’s substantial. But if only $50,000 worth actually trades each day, that billion-dollar valuation isn’t really tested by real buyers and sellers. Try to sell a large position, and you might find the actual market value is much lower.
Hidden token supplies add another layer of confusion. Some projects don’t fully disclose how their tokens are distributed. Others have complex release schedules that gradually flood the market with new supply over months or years. It’s like buying stock in a company without knowing how many shares they plan to issue next quarter.
Index weighting creates a concentration trap that catches many investors off guard. When you buy a “diversified” crypto portfolio based on market cap weights, you’re often getting 60%+ Bitcoin and Ethereum. That’s not really diversification – it’s just betting on two dominant players.
Here’s the biggest misconception: higher market cap doesn’t equal safety. Even Bitcoin and Ethereum have lost 80% of their value during bear markets. Market cap tells you relative size within crypto, not protection from crypto’s inherent volatility.
The 24/7 nature of crypto markets makes manipulation easier than in traditional finance. There’s no closing bell, no circuit breakers, and no regulatory oversight watching for suspicious patterns. This creates unique opportunities for coordinated price manipulation that simply don’t exist in stock markets.
More info about Stablecoins Explained
Frequently Asked Questions about Crypto Market Cap
How is crypto market cap calculated?
Crypto market cap uses a simple formula that anyone can understand: circulating supply multiplied by current price. Think of it like calculating the total value of all the pizza slices in existence – you count how many slices are out there, then multiply by the price per slice.
Let’s use Bitcoin as an example. With 19.7 million coins currently circulating at $96,000 each, Bitcoin’s market cap sits at approximately $1.9 trillion. That’s a number that makes even tech billionaires do a double-take.
The key word here is “circulating” supply. This calculation only includes coins that are actually available for trading right now, not the theoretical maximum that could ever exist. It’s like counting only the cars currently on the road, not every car that could potentially be manufactured.
Some platforms also display fully diluted market cap, which assumes all possible tokens have been released into circulation. This gives you a preview of potential future dilution – imagine if a company suddenly doubled their shares outstanding. Your slice of the pie gets smaller, even if the total pie stays the same size.
Does a higher market cap mean a coin is safer?
Higher crypto market cap generally signals more stability, but calling any cryptocurrency “safe” is like calling a roller coaster a leisurely stroll. Large-cap cryptos like Bitcoin and Ethereum are definitely less likely to vanish overnight compared to that meme coin your college roommate keeps texting you about.
Market cap reflects current investor confidence and liquidity. When a cryptocurrency has billions of dollars invested, it means thousands of people have skin in the game. This makes it harder for any single whale to manipulate prices dramatically.
But here’s the reality check: even Bitcoin, the king of crypto, has crashed by 80% or more during bear markets. Ethereum has taken similar beatings. So while higher market cap means relatively safer within the crypto world, it doesn’t mean safe compared to your grandmother’s savings account.
Think of market cap as indicating your chances of survival in crypto’s wild west, not your chances of avoiding all financial bumps and bruises. Large caps are like riding a horse instead of a mechanical bull – still risky, but you’re less likely to get thrown off immediately.
Can market cap predict future price growth?
Crypto market cap helps you understand growth potential, but it’s not a crystal ball that reveals future riches. It’s more like looking at a map before a road trip – useful for planning, but it won’t tell you about the traffic jams ahead.
Smaller market caps definitely have more mathematical room to grow. A $1 billion project jumping to $10 billion represents 10x growth, which sounds ambitious but achievable. A $100 billion project reaching $1 trillion? That requires moving mountains of money and probably involves convincing your skeptical uncle to finally “get into crypto.”
But here’s the catch that trips up many investors: smaller projects also have much higher chances of completely failing. For every small-cap success story, there are dozens of projects that simply disappeared into the digital ether, taking investors’ money with them.
Use market cap to set realistic expectations for your returns. If you’re hoping for 100x gains, you’ll need to venture into small-cap territory and accept the accompanying risks. If you want steadier growth with less chance of total loss, stick with larger market caps and adjust your profit expectations accordingly.
The smart approach combines market cap analysis with fundamental research about the project’s technology, team credibility, and real-world adoption potential. Numbers tell part of the story, but they can’t capture everything about a project’s future prospects.
Conclusion
Understanding crypto market cap transforms you from someone chasing shiny price tags into a strategic investor who actually knows what they’re buying. At Finances 4You, we’ve seen too many young professionals get burned by focusing on coin prices instead of real market value.
Think of market cap as your financial compass in the crypto wilderness. When you see Bitcoin commanding $1.9 trillion of the market’s total $3.62 trillion value, you understand you’re looking at the digital equivalent of blue-chip stocks. When you spot a promising mid-cap project with strong fundamentals, you can size your position appropriately for your age and income level.
The charts and platforms we’ve covered aren’t just pretty pictures – they’re decision-making tools that can save you from expensive mistakes. Whether you’re using CoinGecko’s dominance tracking or TradingView’s technical analysis, these resources help you make balanced decisions based on data, not emotions.
But here’s the thing: market cap is just one piece of your wealth-building puzzle. Combine it with solid fundamental research, understand your risk tolerance, and never bet more than you can afford to lose completely. The goal isn’t to find the next moonshot that makes you rich overnight – it’s to build sustainable wealth that grows alongside your career.
Continual learning is what separates successful investors from those who get wiped out in the next market crash. The crypto landscape changes rapidly, new projects emerge, and market dynamics shift. Stay curious, keep educating yourself, and remember that even the smartest investors get things wrong sometimes.
Your future self will thank you for taking the time to understand these fundamentals now. Start with what you’ve learned here, practice with small amounts, and gradually build your expertise as your income grows.